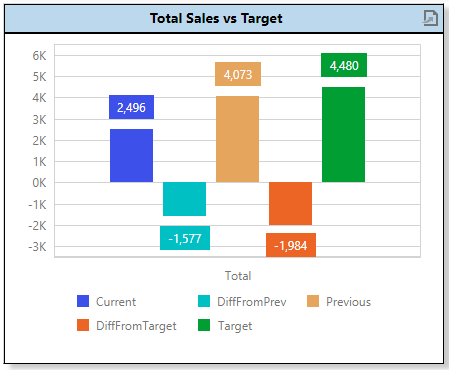
Current – Previous – Target Sales Bar Graph
![](https://one2oneus.com/wp-content/uploads/2018/05/Bar-Graph.png)
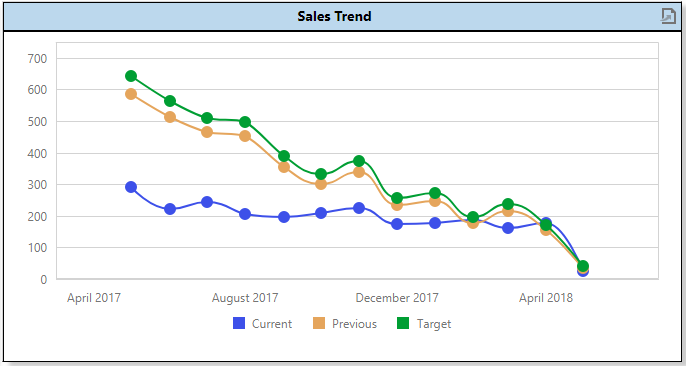
Trending Sales Line Graph
![](https://one2oneus.com/wp-content/uploads/2018/05/Line-Graph.png)
Visual “Cards” – You can see how your sales reps are performing. We also offer other cards for sales by region, etc.
![](https://one2oneus.com/wp-content/uploads/2018/05/Cards.png)
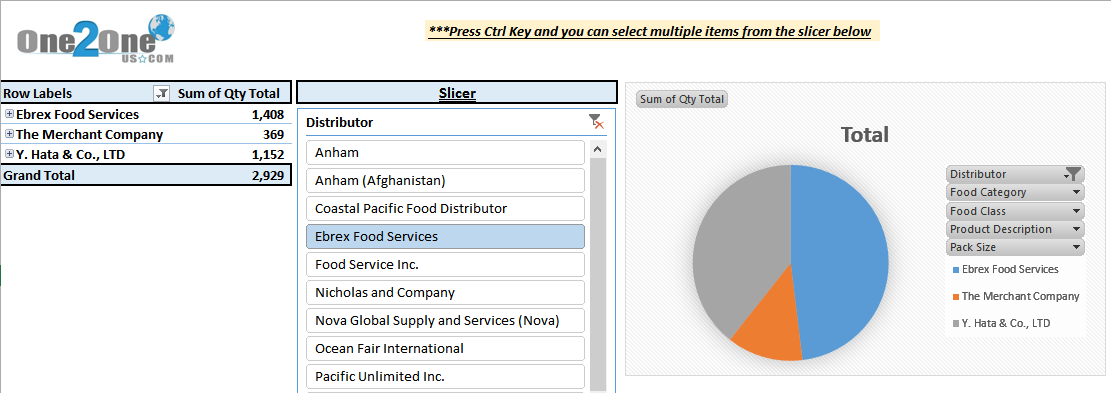
Pivot Reporting with Slicers and Graphs
![](https://one2oneus.com/wp-content/uploads/2018/05/Slicer-Pivot-Table.png)
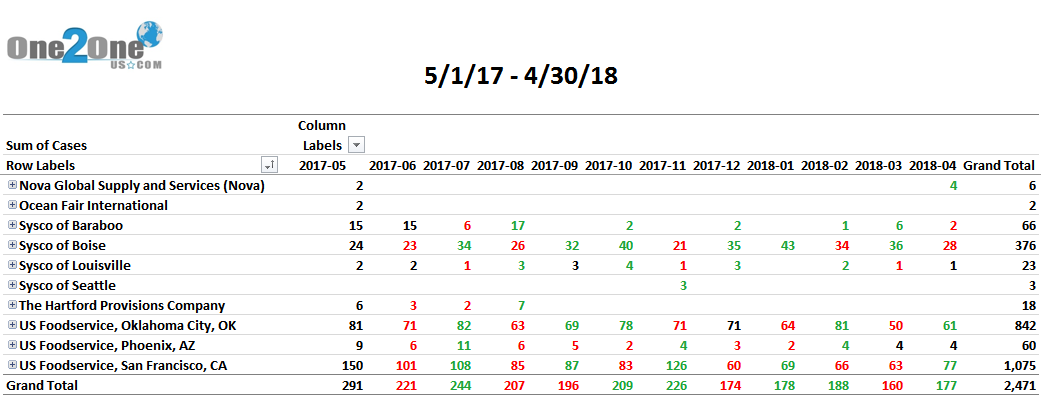
Pivot Reporting with Colored Values to Show When Sales Are Up or Down
![](https://one2oneus.com/wp-content/uploads/2018/05/Color-Pivot.png)